Bitcoin capped below $110K as gold, stocks rally: What’s holding BTC back?
Bitcoin’s price stalling below the psychological $110,000 mark has puzzled traders and long-term investors alike-especially while gold hits fresh highs and major stock indices grind upward. If risk-on is alive and the ultimate store-of-value is shining, why is BTC stuck? This deep-dive unpacks the macro forces, flows, on-chain dynamics, and technical levels that explain the stall-and what may finally unlock the next leg higher.
Quick snapshot: key headwinds vs. tailwinds
| Tailwinds | Headwinds |
|---|---|
| Stock market breadth improving | Stiff resistance near $110K (liquidity + psychology) |
| Gold strength supports “store-of-value” narrative | Plateauing ETF net inflows, slower fresh fiat |
| Halving reduces long-term new supply | Near-term miner selling and treasury hedging |
| Broader institutional adoption | High funding/over-leverage caps spot advances |
| Improving risk appetite | Stronger USD or sticky real yields |
Why gold and stocks can rise while Bitcoin stalls
At first glance, a gold rally alongside a stock market rally suggests both inflation hedging and risk appetite can coexist. Historically, Bitcoin has benefited from both regimes. Yet BTC often behaves differently around major round numbers: order books thicken, option dealers hedge aggressively, and whales distribute to short-term momentum buyers. That interplay can mute upside even when the cross-asset backdrop looks supportive.
Macro drivers to watch
- Real yields (inflation-adjusted rates): Lower or stable real yields typically support risk assets and Bitcoin. If real yields stop falling-or rise-BTC’s upside can be constrained even as equities rally on earnings.
- U.S. dollar strength (DXY): A firmer dollar often correlates with softer BTC. Gold can rise with a strong dollar during geopolitical hedging, but BTC tends to be more sensitive to USD cycles.
- Liquidity and credit conditions: Improving credit spreads help stocks. Bitcoin, however, needs direct crypto-native liquidity-like stablecoin supply growth and spot ETF inflows-to push through stacked sell orders near $110K.
Flow and microstructure: the “plumbing” matters
When Bitcoin is capped below a major level, the culprit is often not narrative, but flows. Two sets of flows dominate BTC’s short-term path: spot demand (including ETFs and high-net-worth buying) and derivatives positioning.
ETF flows and the “new money” problem
- Net inflow slowdown: Even modest deceleration in spot ETF net inflows can stall rallies. ETFs became a crucial source of structural demand; when those pipes narrow, upside momentum fades.
- Rebalancing and arbitrage: Authorized participants and market makers may sell into strength to keep creations/redemptions aligned, adding supply at round-number caps.
- Allocation cycles: Institutions typically rebalance monthly or quarterly. Between windows, “dry powder” can be limited, keeping BTC range-bound.
Derivatives: funding, basis, and options gamma
- Elevated funding rates: If perpetual swaps pay rich positive funding, the market is leaning long. Market makers counterbalance by shorting or selling spot into strength, capping advances.
- Futures basis: A hot basis can drive cash-and-carry trades that add mechanical sell pressure on spot.
- Options positioning: Dense call open interest around $110K-$120K can create “sticky strikes.” Dealers hedge by selling spot or buying puts, dampening breakouts until strikes roll off or IV spikes.
Supply overhang: miners and long-term holders
Miner behavior post-halving
While the halving reduces new supply, miners still need to fund operations. If margins tighten-due to difficulty jumps, energy costs, or slower price appreciation-miners may sell more coins into strength or use forwards to hedge, creating headwinds near resistance.
Long-term holder distribution at round numbers
Round numbers invite programmatic profit-taking. Wallets that accumulated lower often scale out at pre-set targets (e.g., $100K, $110K, $120K), providing steady overhead supply. This is healthy: it broadens ownership and resets the base for sustainable advances.
Technical picture: why $110K is hard to crack
$110,000 is both a psychological level and, in many models, a confluence area for liquidity pockets, option strikes, and measured-move extensions. Breaking it cleanly usually requires either a surge in spot demand or a clearing event in derivatives positioning.
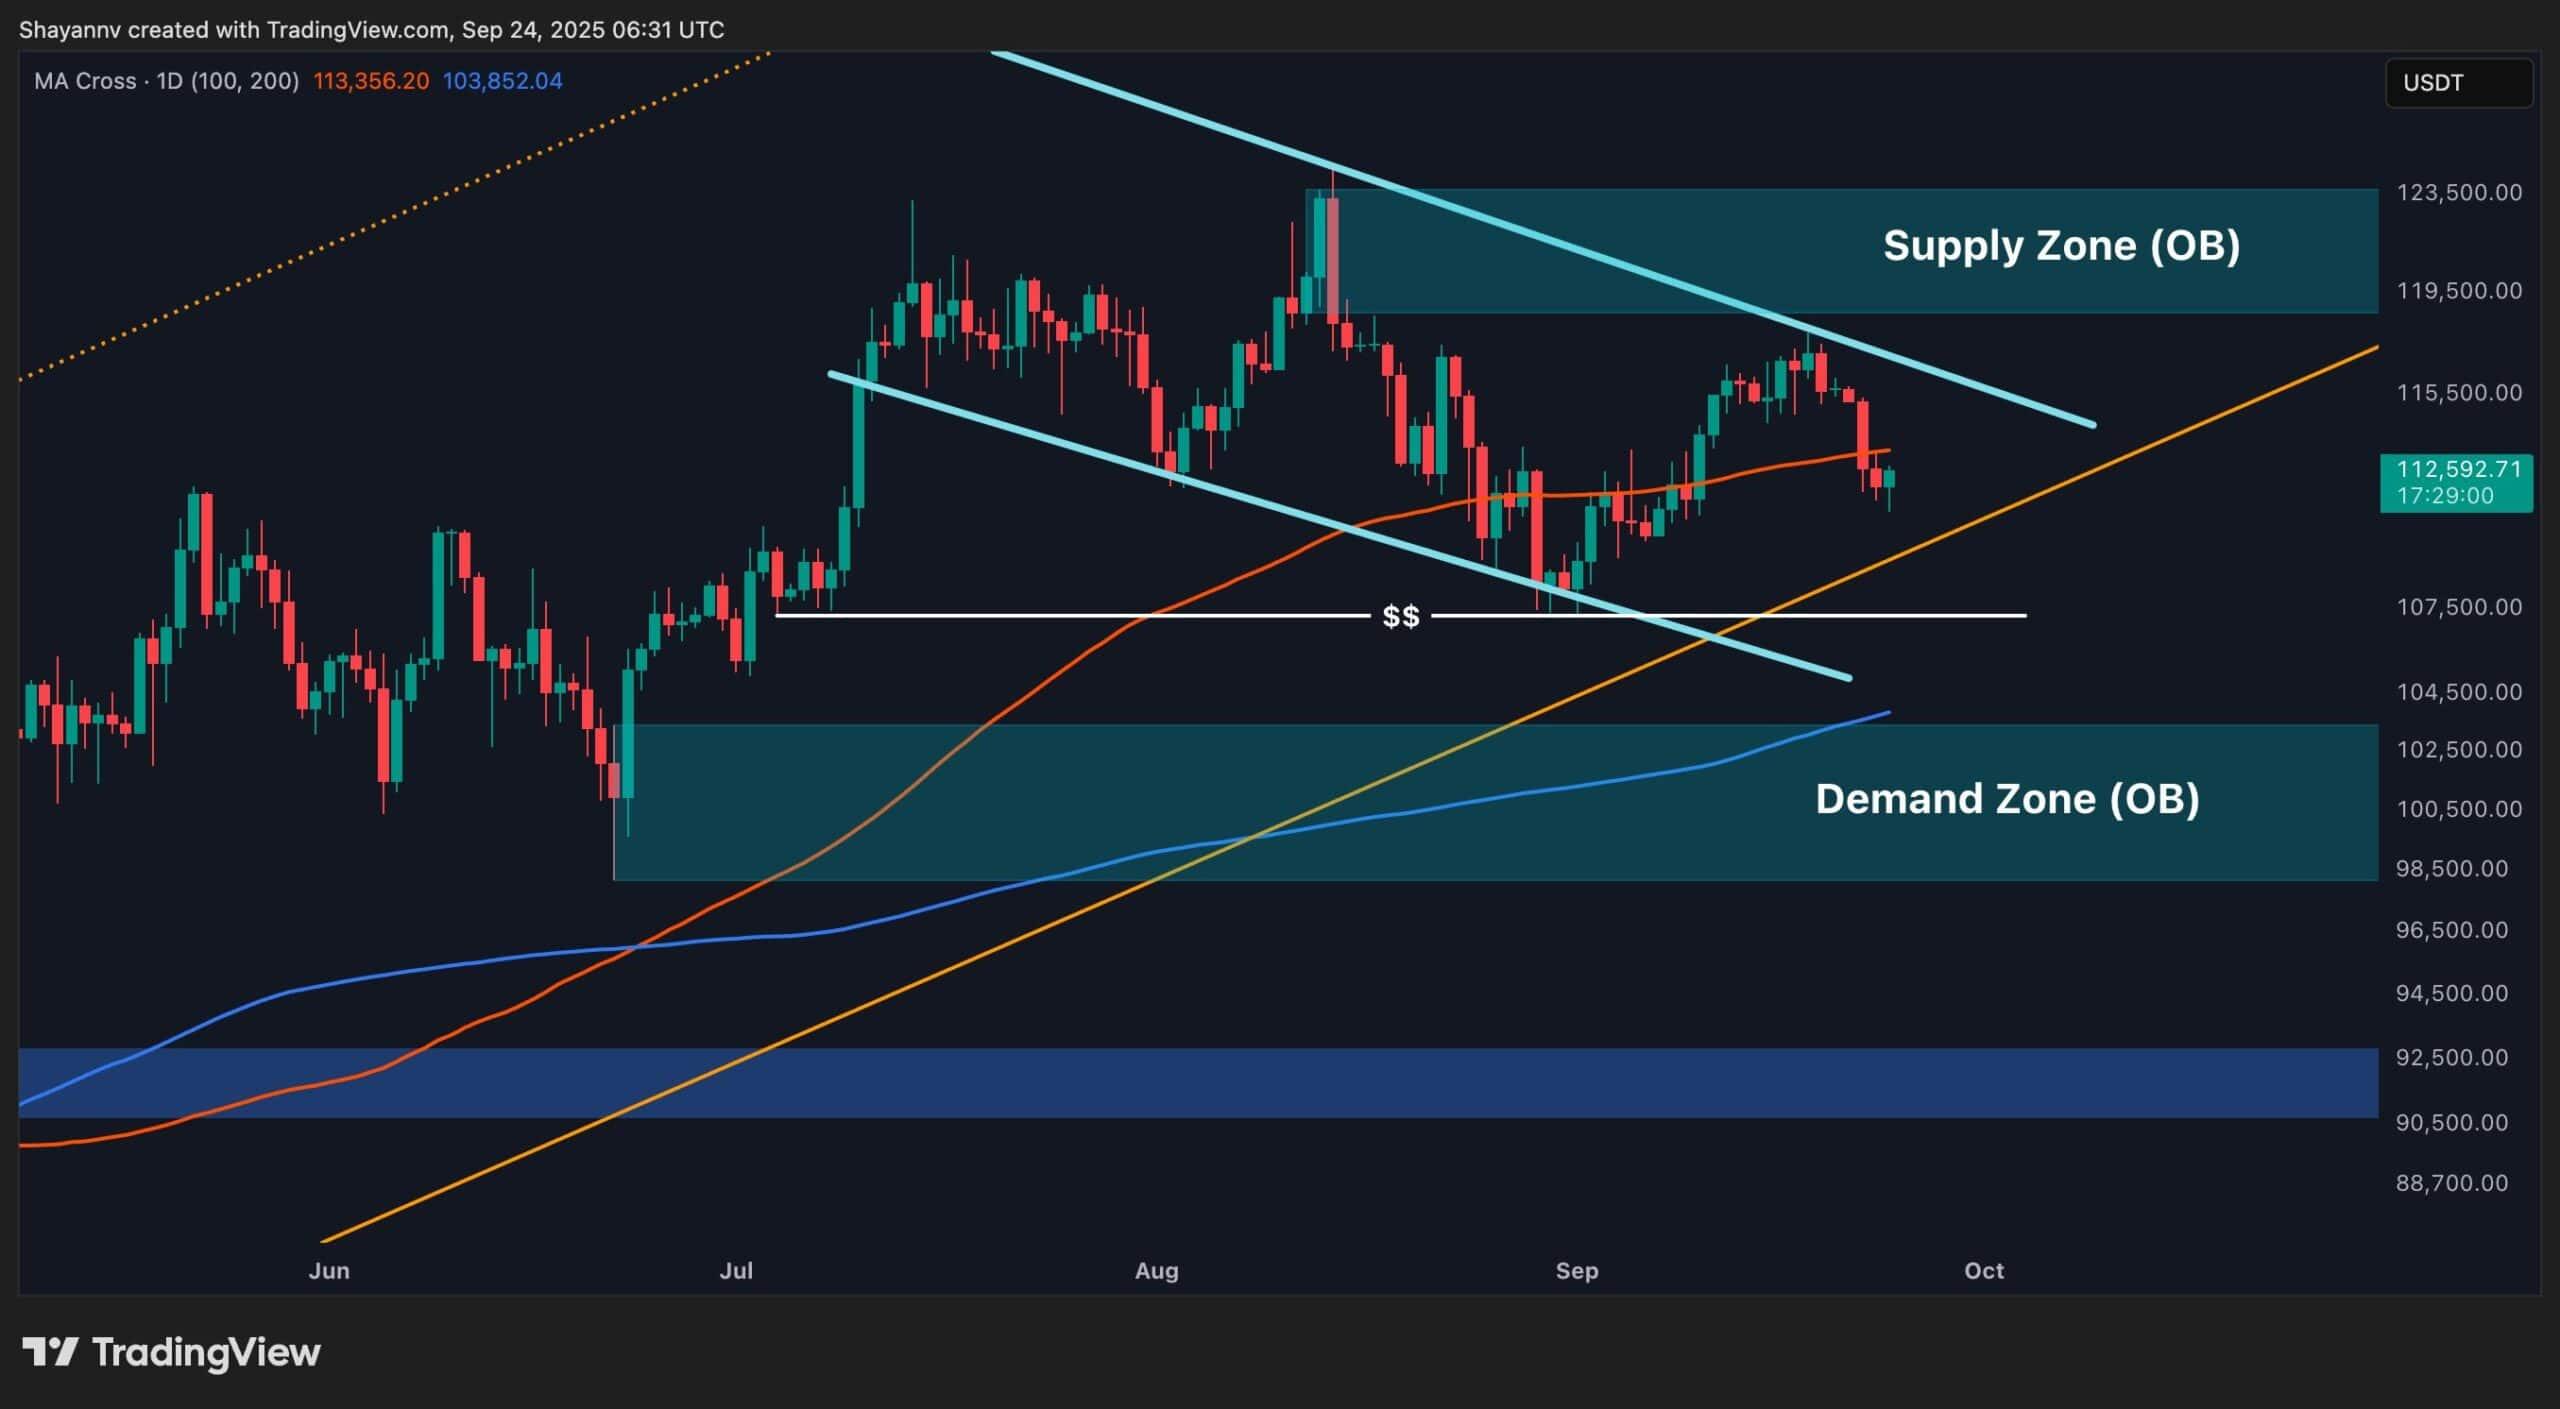
Key levels and signals
- Immediate resistance: $110K-$112K (liquidity sweep zone where stops and take-profits cluster)
- Upside continuation: Acceptance above $115K on strong volume and positive spot CVD
- Support to hold: $100K-$102K (round-number support, prior breakout retest)
- Deeper supports: $96K and $92K if momentum fades
- Invalidation for bulls (HTF): Weekly close below the prior higher low structure
Traders often look for a weekly close above resistance with rising spot volume and cooling funding rates to confirm a real breakout rather than a stop-driven wick.
Regulatory and narrative overhangs
- Policy ambiguity: Mixed signals on crypto regulation can depress risk appetite for new institutional allocators.
- Stablecoin rules: Stablecoin legislation remains a swing factor for crypto-native liquidity. Clear frameworks tend to boost confidence and capital flows.
- Accounting and custody: Institutional mandates require clarity on custody, fair value accounting, and risk treatment; delays slow onboarding of large balance sheets.
What could finally break the $110K cap?
Several catalysts could provide the torque needed to clear overhead supply and trigger a momentum regime:
- Re-acceleration in spot ETF inflows: Multi-day net inflows and heavier creations signal new fiat entering.
- USD softening and lower real yields: A weaker dollar and easing real rates typically favor BTC breakouts.
- Derivatives reset: Funding normalizes, elevated open interest is flushed, and options gamma shifts higher.
- Corporate adoption headlines: Treasury allocations or balance sheet diversification can catalyze repricing.
- On-chain liquidity growth: Rising stablecoin market cap and exchange net outflows suggest accumulation.
Practical tips: navigating a capped Bitcoin market
- Respect the range: Trade the range until it breaks. Fade edges ($100K-$110K) with tight risk, and switch to trend strategies on confirmation.
- Watch spot vs. perps: Breakouts led by spot volumes and positive CVD are higher quality than perp-led wicks.
- Monitor ETF dashboards: Sustained positive net creations often precede durable uptrends.
- Track funding and basis: Elevated funding signals crowded longs; neutral to slightly positive is healthier for breakouts.
- Time frames matter: Demand weekly confirmation above resistance to avoid chop and bull traps.
- Position sizing: Use staggered entries and stop-loss discipline; consider options for defined risk around binary events.
| Metric | Signal | Why it matters |
|---|---|---|
| Spot ETF net flows | Multi-day positive | Confirms fresh fiat demand |
| Funding rate | Near neutral | Avoids crowded long squeezes |
| Open interest | Rises with price | Healthy participation, not forced |
| USD (DXY) | Trending lower | Tailwind for BTC risk appetite |
| Real yields | Stable to lower | Supports risk assets and BTC |
| Stablecoin supply | Expanding | Crypto-native liquidity rising |
Cycle context: capping at round numbers is normal
Bitcoin’s history is filled with stalls at psychologically important levels. These “ceilings” are less about intrinsic value and more about liquidity and positioning. Past examples show how prolonged caps can eventually give way to trend resumption once supply is absorbed and a new marginal buyer emerges.
| Cycle | Round-number cap | What broke it |
|---|---|---|
| 2017-2020 | $20K | Institutional flows + macro liquidity |
| 2021 | $60K | Derivatives reset + fresh spot demand |
| Current | $110K | ETF inflows + weaker USD + options roll |
Benefits and risks of waiting for confirmation
Benefits
- Higher probability entries: Reduce false breakout risk by requiring weekly closes above resistance.
- Trend alignment: Join moves with confirmed momentum and supportive flows.
- Clarity on macro: Let the dollar trend and rate path confirm a supportive backdrop.
Risks
- Opportunity cost: Waiting can miss the first fast move post-breakout.
- Whipsaw risk: Markets can reclaim and lose levels in fast sequences; use stop-losses.
- Slippage: Breakouts with volume can gap, increasing execution cost.
Frequently asked questions
Why is Bitcoin lagging if gold is rallying?
Gold can rally on geopolitical hedging and central bank accumulation even when the dollar is firm. Bitcoin remains more sensitive to USD cycles, derivatives positioning, and crypto-native liquidity (stablecoins, ETFs). Those factors can offset the store-of-value narrative in the short run.
Is Bitcoin still an inflation hedge?
Over long horizons, BTC’s fixed supply and adoption dynamics can hedge monetary debasement. In the short term, performance is driven by liquidity, real yields, and market structure-so the hedge may not appear in every quarter.
Should I wait for a break above $110K to buy?
It depends on your strategy. Trend followers prefer confirmed breaks with spot-led volume; value accumulators may dollar-cost average, accepting volatility. A blended approach-partial DCA plus breakout adds-balances both.
Actionable checklist for the coming weeks
- Set alerts at $110K, $112K, and $115K for breakout confirmation.
- Track rolling 5-day spot ETF net flows; look for consistent positives.
- Watch funding rate dispersion across major exchanges; aim for neutral.
- Monitor DXY and 10-year real yields for macro tailwinds.
- Check stablecoin total market cap for signs of fresh liquidity.
- Use position sizing and stops; consider protective puts around binary events.