Crypto Sentiment Flips to ‘Fear’ as Bitcoin Plunges After Trump’s Tariffs
Introduction
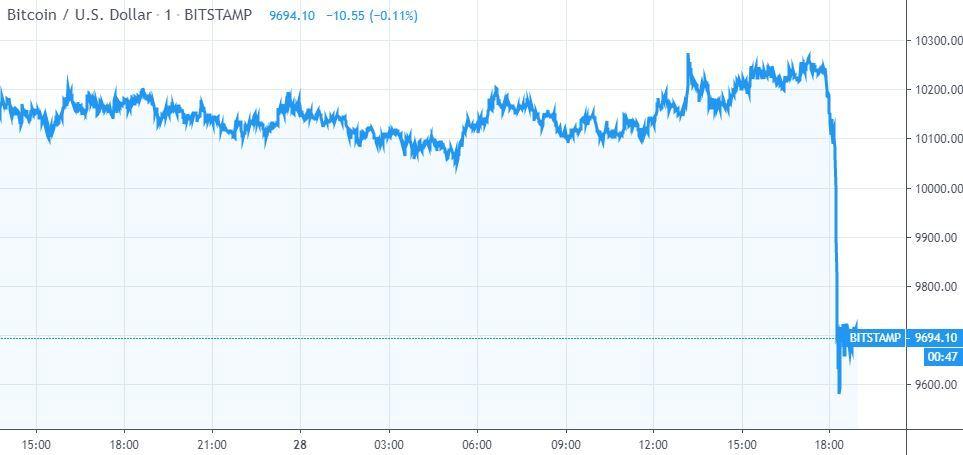
The crypto market’s mood turned sharply risk-off as Bitcoin plunged following headlines about new Trump tariffs on key imports. Within hours, market chatter centered on the Crypto Fear and Greed Index sliding back into “Fear,” renewed volatility across altcoins, and a brisk pickup in stablecoin demand. For many traders and long-term allocators, this moment stirred a familiar question: why do geopolitics and trade policy-particularly tariff shocks-so often spill into Bitcoin price action and broader crypto market sentiment?
In this guide, we break down what happened, why tariffs can pressure risk assets like BTC in the short term, and how to navigate the fallout using a simple, repeatable playbook. You’ll also find practical tips, historical context, and key indicators to monitor as the market recalibrates.
What Happened and Why Markets Care
Markets broadly dislike uncertainty. When a new tariff regime appears-especially from a major economy-investors immediately reassess growth, inflation, and liquidity pathways. That reassessment often pushes portfolios into defensive positioning, amplifying volatility in assets that rely on abundant risk appetite, including cryptocurrencies.
Here’s the typical chain reaction following tariff headlines:
- Inflation expectations tick up: Tariffs can raise import costs and nudge prices higher, complicating central bank policy.
- Yields and the dollar firm: Higher inflation risk can push Treasury yields and the U.S. dollar (DXY) up-usually a headwind for BTC and risk assets.
- Risk appetite weakens: Equities wobble, crypto volatility rises, and traders reduce leverage and rotate into cash or stablecoins.
- Positioning resets: Liquidations cluster as funding turns negative and momentum breaks near key technical levels.
How Tariffs Ripple Into Crypto
While Bitcoin is often marketed as a hedge against fiat debasement, in the short term it trades as a high-beta, liquidity-sensitive asset. Tariff news can hit crypto through several channels:
- Dollar strength: A stronger DXY historically correlates with softer BTC performance.
- Higher real yields: Attractive risk-free yields can siphon capital away from speculative assets.
- Volatility shocks: Sudden macro shifts force de-risking and raise margin pressures in derivatives-heavy crypto markets.
- Liquidity thinning: Wider spreads and lower depth increase slippage, intensifying moves.
That said, tariffs also revive Bitcoin-as-hedge narratives over longer horizons: capital controls risk, trade fragmentation, and geopolitical tension can bolster the case for permissionless, non-sovereign money. The time horizon matters.
Sentiment Flips to “Fear”: Reading the Signals
The Crypto Fear and Greed Index aggregates market sentiment from volatility, market momentum, social chatter, dominance, and trends. A drop into “Fear” typically aligns with:
- Funding rates softening or turning negative on perpetual futures.
- Liquidations spiking, especially on leveraged long positions.
- Rising stablecoin dominance as traders seek safety and dry powder.
- Declining altcoin breadth and underperformance versus BTC.
When fear prevails, short-term price dislocations can overshoot. For position traders, that can present opportunities-if paired with strict risk management.
Your Tariff Shock Dashboard: What to Watch
Use this simple dashboard to contextualize the crypto move and spot shifts early.
| Indicator | What It Signals for Crypto | Where to Watch |
|---|---|---|
| U.S. Dollar (DXY) | Stronger dollar tends to pressure BTC/altcoin prices. | Macro terminals, Forex dashboards |
| U.S. 10Y Yield | Higher real yields reduce appetite for risk assets. | Bond trackers, Treasury data |
| Funding Rates | Negative funding = shorts paying longs; risk of squeezes. | Exchange derivatives pages |
| Stablecoin Dominance | Rising dominance = risk-off; dry powder building. | Market cap aggregators |
| BTC Dominance | Rising dominance = altcoins underperform in stress. | Crypto market analytics |
Technical Picture: Key Levels and Market Structure
Tariff shocks often arrive when the market is already leaning in one direction. That can accelerate breaks and draw price toward high-liquidity zones. Consider these technical checkpoints:
- 200-day moving average (DMA): A widely watched bull-bear threshold. Sustained closes below it can extend risk-off.
- Prior breakout/accumulation ranges: Price often retests the top of old ranges for confirmation.
- Round-number liquidity: Market makers and stops cluster around round levels (e.g., 60k, 55k).
- Weekly 20/50 EMAs: Confluence zones where trend followers make decisions.
On altcoins, beta cuts both ways. When fear spikes, ETH/BTC and many mid-cap alts lose relative strength first, with liquidity gaps exaggerating downside. Focus on pairs with robust order books if you must trade during volatility.
On-Chain and Derivatives Checkup
To separate signal from noise, layer on on-chain and derivatives metrics:
- Exchange reserves: Rising BTC/ETH balances on exchanges can indicate sell intent; declining reserves suggest accumulation.
- Realized profit/loss (SOPR): Sub-1 readings imply coins moving at a loss-often near capitulation zones in downswings.
- MVRV/NUPL: Gauges the average investor’s profit state; drops toward neutral/undervalued can mark better risk-reward.
- Open interest and liquidation maps: Elevated OI plus thinning liquidity increases whip-saw risk; watch for cluster sweeps.
- Funding and basis: Deeply negative funding and compressed basis can precede mean reversion rallies if spot demand returns.
Winners and Losers in a Tariff-Driven Risk-Off
Not all crypto segments react the same way:
- Stablecoins: Typically see inflows as traders park capital and wait out volatility.
- Bitcoin vs. Altcoins: BTC dominance often rises as capital consolidates into the most liquid crypto asset.
- DeFi yields: Volatility can push up variable rates; smart routing captures better yields with selective risk.
- Infrastructure tokens: Thin liquidity pairs and smaller caps suffer the steepest drawdowns and slower recoveries.
Practical Playbook: What You Can Do Now
- De-risk leverage: Tighten position sizing and lower leverage until volatility normalizes.
- Stagger entries: Use dollar-cost averaging (DCA) or laddered bids near confluence levels.
- Hedge smartly: Consider defined-risk options strategies (e.g., debit puts) rather than naked shorts.
- Follow the data: Track DXY, yields, funding, OI, and stablecoin flows daily; react to trend changes, not headlines alone.
- Focus on liquidity: Trade top pairs and avoid thin books during stress to minimize slippage.
- Respect time frames: Differentiate between short-term volatility and long-term adoption narratives.
| Investor Type | Objective | Key Risk Now | First Steps |
|---|---|---|---|
| Long-Term Allocator | Accumulate BTC/ETH over years | Buying too fast into falling knives | Use DCA, add at multi-support confluence |
| Swing Trader | Catch mean reversion | Whipsaws from liquidations | Wait for funding/OI reset, trade retests |
| DeFi Participant | Yield with principal safety | Smart-contract and depeg risk | Diversify venues, monitor reserves/oracles |
| Miner/Treasurer | Balance cashflow and runway | Revenue volatility | Hedge with collars; pace treasury sales |
| Builder/Startup | Runway preservation | Token price drawdown | Convert a slice to stables; extend runway |
Historical Context: What Past Shocks Teach Us
Trade War Headlines and BTC
During prior trade tensions, tariff headlines frequently coincided with risk-off episodes in equities and crypto. While not perfectly correlated, the pattern is clear: stronger dollar and rising yields often compress crypto multiples. However, Bitcoin’s long-term uptrend has endured multiple macro scares, with demand rebuilding once policy paths and growth expectations stabilize.
Macro Shocks and Volatility
- 2018-2019: Trade war uncertainty saw repeated risk-off days; BTC alternated between safe haven narratives and liquidity-driven selloffs.
- 2020: COVID-19 liquidity crunch (March) showed how systemic de-risking can hit all assets simultaneously, followed by a powerful recovery as liquidity returned.
- 2022: Rate shock and a stronger dollar pressured crypto; correlations to high-beta tech rose, underscoring liquidity sensitivity.
The lesson: narrative can diverge from price in the short term. Liquidity and positioning dominate first; fundamentals and adoption reassert over longer windows.
FAQs
Why do tariffs hit Bitcoin and crypto?
Tariffs can raise inflation risk and strengthen the dollar and yields, reducing demand for risk assets. In derivatives-heavy crypto markets, that often triggers de-leveraging, liquidations, and a slide into “Fear.”
Is a flip to “Fear” a buy signal?
Not by itself. “Fear” can persist. Pair it with evidence of stabilization-funding normalization, declining open interest, and successful retests of key support-before scaling in.
Do altcoins recover faster than Bitcoin?
Typically no. In risk-off regimes, BTC dominance often rises. Altcoins tend to recover later, once liquidity improves and volatility cools.
What should I monitor day-to-day?
Watch DXY, real yields, funding rates, open interest, stablecoin dominance, and BTC’s 200DMA/weekly EMAs. Together, they provide a coherent read on risk appetite.
How do tariffs affect crypto long term?
Trade frictions and geopolitical stress can support the long-run case for neutral settlement rails and non-sovereign money, but the path is uneven and punctuated by bouts of volatility.
Benefits of a Disciplined Macro-Crypto Framework
- Consistency: A fixed set of indicators avoids headline chasing.
- Risk control: Predefined position sizing and hedging rules reduce drawdown severity.
- Adaptability: The same playbook applies across shocks-tariffs, CPI surprises, policy pivots.
- Edge compounding: Over time, systematic evaluation beats reactive, emotion-driven trades.
Conclusion
In the wake of Trump tariff headlines, the crypto market did what it often does under macro stress: it flipped to “Fear,” amplified volatility, and forced a fast positioning reset. While unsettling, these episodes are neither new nor insurmountable. With a clear dashboard-tracking the dollar, yields, funding, open interest, and dominance-and a disciplined approach to risk, traders and investors can turn volatility into opportunity.
Ultimately, short-term macro headwinds and liquidity shocks clash with the long-run arc of crypto adoption. Navigating both horizons requires patience, data, and process. Keep your playbook handy, adjust position sizes to the regime, and let the market show you when sentiment genuinely turns from “Fear” toward “Greed” again.